Advancing Fairness in Visual Learning
Leonardo Iurada
POLITECNICO DI TORINO
leonardo.iurada@polito.it
In a world increasingly shaped by artificial intelligence, it is essential to ensure that these technologies are not only accurate and powerful but also equitable and unbiased. In particular, computer vision applications are supportive tools in our daily lives, helping us to store and organize photos, navigate the streets of a new city, choose what to wear or what couch will fit best in our living room. However, they also play a relevant role in more critical decisions including healthcare, policing, employment and more. One aspect that is currently keeping low the level of trust associated with vision systems is their potential unfairness, meaning that the models may exploit spurious sensitive attribute correlations (e.g. age, gender, race) when solving seemingly unrelated tasks on data coming from different demographic groups.
With this project page we would like to contribute to the numerous efforts that the research community is currently pursuing towards fair computer vision models. Specifically we present our work dedicated to the definition of a fairness benchmark which spans both face and medical images for classification and landmark detection tasks.
Tasks
We remark that current unfairness mitigation strategies in computer vision are restricted to classification problems. To overcome this limitation, we include in our benchmark the task of landmark detection on face images of different demographic groups, as the bias related to sensitive attributes can affect the precision with which critical keypoints are located.
Methods
Resolving the fairness issue while maintaining accurate predictions for the target task is a challenge shared with the domain adaptation and generalization literature which focuses on avoiding visual domain biases. Thus, we start our study by investigating the connection between cross-domain learning (CD) and model fairness by evaluating 14 CD learning approaches alongside three state-of-the-art (SOTA) fairness algorithms. We conclude that the former can outperform the latter.
Here is the list of the evaluated methods:
| Baseline |
For our classification experiments we follow the fairness literature [1] adopting as baseline ResNet50 with standard cross-entropy minimization objective, pretrained on ImageNet. For landmark detection we follow [2, 3] and consider ResNet18 pre-trained on ImageNet with a dedicated head composed of deconvolutional layers. The network is optimized with an L2 loss to reduce the discrepancy between the predicted probability distribution of the location of each landmark and the ground truth. |
|---|---|
| Classification | |
| Regularization-Based Methods | |
| Include all the techniques designed to prevent overfitting with a consequent boost in the model generalization ability. | |
| LSR | Encourages the model to avoid overconfidence by smoothing data annotation. [4] |
| SWAD | Searches for flat minima. [5] |
| RSC | Is based on a refined drop-out. [6] |
| L2D | Includes a module trained to synthesize new images with a style distribution complementary to that of the training data. [7] |
| Adversarial Training Methods | |
| Encode domain-invariant representations by preventing the network to recognize the domains. | |
| DANN | The gradient computed by a domain discriminator is inverted while learning the data representation. [8] |
| CDANN | Improves over DANN by matching the conditional data distributions across domains rather than the marginal distributions. [9] |
| SagNets | Introduces dedicated data randomizations to disentangle style from class encodings. [10] |
| Feature Alignment Methods | |
| Involve training objectives that minimize domain distance measures. | |
| AFN | Measures domain shift by comparing the feature norms of two domains and adapts them to a common large value. [11] |
| MMD | Minimizes the homonym metric to reduce the domain discrepancy. [12] |
| Fish | Proposes to align the domain distributions by maximizing the inner product between their gradients. [13] |
| Self-Supervised Learning-based Methods | |
| Exploit auxiliary self-supervised tasks to let the network focus on semantic-relevant features. | |
| RelRot | Predicts the relative orientation between a reference image (anchor) and the rotated counterpart as auxiliary task. [14] |
| RelRotAlign | A variant of RelRot to encourage the domain alignment using as anchor a sample with the same target attribute but from a different protected group. |
| SelfReg | Exploits contrastive losses to regularize the model and guide it to learn domain-invariant representations. [15] |
| State-of-the-art Fairness Methods | |
| These approaches are tailored specifically to mitigate unfairness. | |
| GroupDRO | Minimizes the worst-case training loss over a set of pre-defined groups. [16] |
| g-SMOTE | Is a generative approach that reduces unfairness by synthesizing new samples of the most disadvantaged group. [17] |
| FSCL | Re-designs supervised contrastive learning to ensure fairness by paying attention to the choice of the negative samples and to the distribution of the anchors between data groups. [18] |
| Landmark Detection | |
| RegDA | It is developed to target human pose estimation and introduces an adversarial regressor based on the Kullback-Leibler divergence between domains to narrow their gap. [19] |
Metrics
Another aspect on which there is still a lot of confusion and open debate is about how systems should be evaluated. There are multiple competing notions of fairness and ways to quantify it. Previous studies measure group fairness by accuracy difference between advantaged and disadvantaged subgroups. However, this goal has been criticized in philosophy and ethics literature. Purely minimizing the gap between subgroup performance, may lead to choosing a model with worse accuracy for all subgroups, which is Pareto inefficient and violates the ethical principles of beneficence and non-maleficence. Thus, we analyze several existing group fairness criteria and highlight the lack of a metric that properly aggregates overall performance and fairness level to assess the quality of a model.
The metrics used in our evaluation are:
| Classification | |
|---|---|
| Acc. | Classification accuracy. |
| MGA | Max Group Accuracy, the classification accuracy of the best-performing protected group. |
| mGA | Min Group Accuracy, the classification accuracy of the worst-performing protected group. |
| DA | Difference in Accuracy. Measures Fairness by computing the difference in accuracy between protected groups. \[DA = MGA - mGA\] The lower, the better. |
| DEO | Difference in Equal Opportunity. Measures Fairness by \[|P(\hat{y}=1|y=1,a=0) - P(\hat{y}=1|y=1,a=1)|\] where \(\hat{y}\) is the classifiers prediction, \(y\) is the target label and \(a\) is the sensitive attribute. The lower, the better. |
| DEOdds | Difference in Equalized Odds Measures Fairness by \[\sum_{t \in \{0,1\}}|P(\hat{y}=1|y=t,a=0) - P(\hat{y}=1|y=t,a=1)|\] The lower, the better. |
| ΔDTO | Difference in Distance To Optimum. A perfectly fair and accurate classifier exhibits \([MGA^*, mGA^*] = [100, 100]\) (Utopia). Thus, we define as \(DTO\) (Distance To Optimum) as the L2 distance between \([MGA,mGA]\) of a method and the Utopia point \([MGA^*, mGA^*]\). To estimate the relative performance of each method with respect to the baseline, we report \[\Delta DTO = DTO_{baseline} - DTO_{method}\] The higher, the better. |
| Landmark Detection | |
| When dealing with landmark detection every data sample can be defined as \((\boldsymbol{x}, a, \boldsymbol{Y})\), where \(\boldsymbol{Y} \in \mathbb{R}^{K \times 2}\) is a set of \(\boldsymbol{y}_{1,...,K}\) landmark coordinates. The reference metric for this task is the Normalized Mean Error (NME) calculated as: \[NME(\boldsymbol{Y}, \hat{\boldsymbol{Y}}) = \frac{1}{N} \sum_{i=1}^K \frac{\| \boldsymbol{y}_i - \hat{\boldsymbol{y}}_i \|_2}{D} \] where \(D\) is a normalization factor, usually chosen as the interocular distance for face images. The lower the NME, the better. | |
| SDR | Success Detection Rate is the percentage of images whose NMEs is less than a given threshold. The higher, the better. |
| MGS | Max SDR, the SDR of the best-performing protected group. |
| mGS | Min SDR, the SDR of the worst-performing protected group. |
| DS | Difference in SDR Measures Fairness by computing the difference in SDR between protected groups. \[DS = MGS - mGS\] The lower, the better. |
| ΔDTO | Difference in Distance To Optimum. The definition is analogous to the one given for the classification task, but using MGS and mGS. |
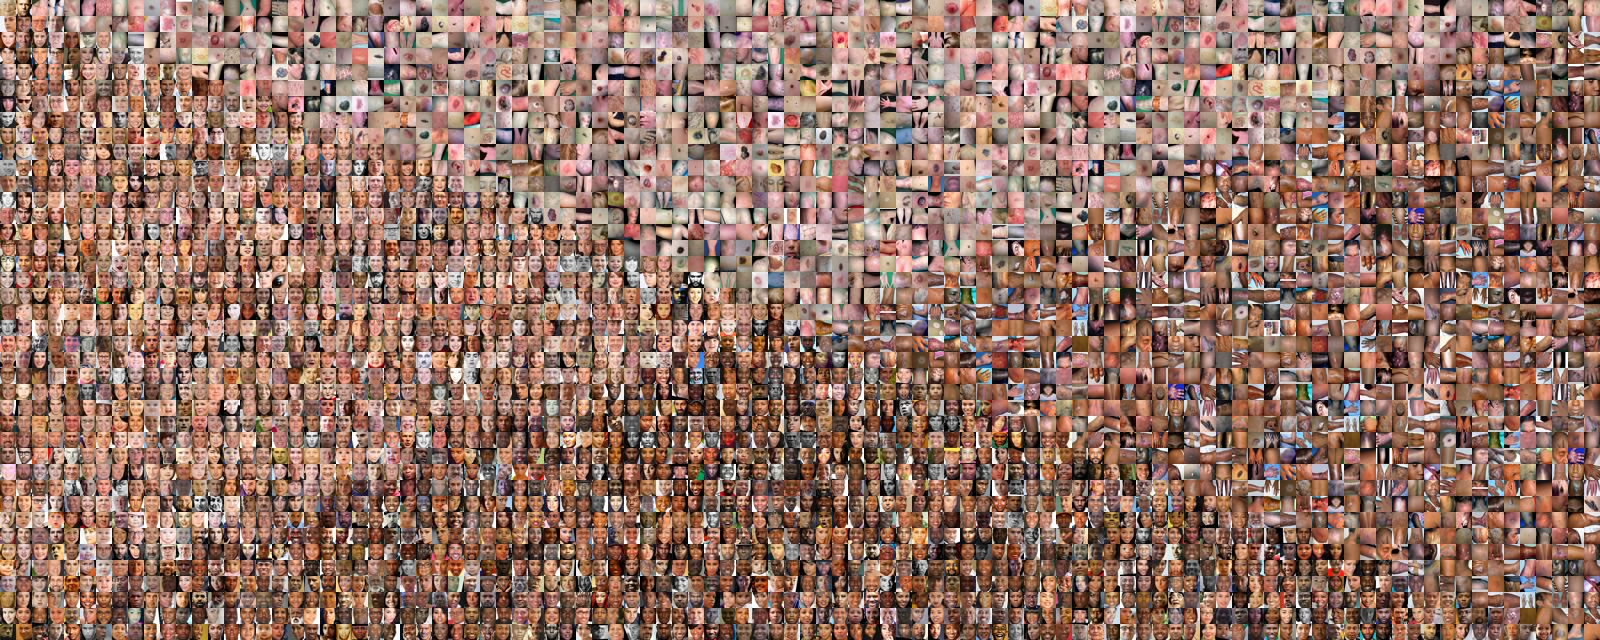
Datasets
| CelebFaces Attribute (CelebA) | [20] comprises 202,599 RGB face images of celebrities, each with 40 binary attribute annotations. We focus on the same subset of 13 reliable target attributes considered in [1, 17], as they can be labeled objectively, without being ambiguous for a human. We select male and young as protected attributes, and adopt the same setting of [17], based on the official train/val/test splits. |
|---|---|
| COVID-19 Chest X-Ray | [21] is composed of 719 images of chest x-ray coming from different online sources showing scans of patients affected by pulmonary diseases. Each image has a structured label describing many attributes of the patient. We focus on the finding attribute as target, considering the COVID-19 pathology, while gender is selected as sensitive attribute. We split the dataset into 80/20% training/test sets, using 20% of the training split for validation. |
| Fitzpatrick17k | [22] is a collection of 16,577 clinical images depicting 114 skin conditions from two dermatology atlases. The images are annotated with the six Fitzpatrick skin type labels, that describe the skin phenotype’s sun reactivity. The dataset is widely used in algorithmic fairness research [23]. We classify whether the dermatological condition in each picture is either benign/non-neoplastic or malignant and we use skin tone as the protected attribute, keeping only the examples belonging to skin type I (light) and skin type VI (dark) of the Fitzpatrick scale. We split the dataset into 80/20% training/test sets, using 20% of the training split for validation |
| UTKFace | [24] consists of over 20k RGB face images characterized by great variability in terms of pose, facial expression, illumination, etc., and present age, gender, and race annotations. We focus on landmark localization (68 points) considering the values white and black of the label race as protected groups for the experiments related to skin tone. Moreover, we define the young and old groups by collecting respectively samples with the value of label age in 0-10 and 40-50 years old. Training/test division is in the proportion 80/20% with 20% of the training split used for validation. |
Results
Here we present the main results of our experiments. Our PyTorch implementation covers all the methods evaluated in the benchmark to guarantee maximal transparency and reproducibility. It can also easily include other methods for future benchmark extensions. Unless stated otherwise, for all the experiments we adopted the same validation protocol described in [17].
01. Classification Results
CelebA - 13 Attributes (gender)
CelebA - EyeBags (gender)
CelebA - Chubby (gender)
COVID-19 Chest X-Ray (gender)
Fitzpatrick17k (skin tone)
02. Landmark Detection Results
UTKFace - Landmark Detection @ 8% NME
03. Model Transferability
CelebA - EyeBags
UTKFace - Landmark Detection @ 8% NME
From the results of the classification task we observe that the advantage obtained with the gender-robust model on different age groups is not symmetric: the results in the right part of the table show that none of the methods improve over the baseline according to \(\Delta DTO\). The transferability results look instead always very promising on landmark detection where a model trained to be fair on skin tone is effective also in reducing the performance gap among different age groups and vice versa.
References